Graphs and charts are great because they communicate information visually. For this reason, graphs are often used in newspapers, magazines and businesses around the world. You are going to use the data from your interviews to create your own graphs.
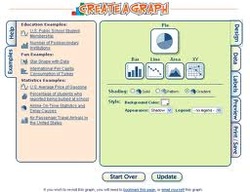
Altogether you have 5 questions so you will need to create 5 graphs or charts. At least one must be a hand drawn bar chart and at least one must be a hand drawn circle graph but you can also use this website to create your own graphs and charts.
Altogether you have 5 questions so you will need to create 5 graphs or charts. At least one must be a hand drawn bar chart and at least one must be a hand drawn circle graph but you can also use this website to create your own graphs and charts.
 RSS Feed
